The Field Track Reports designer is only available to "Field Track User Club" members. The report designer also has its own help file, which may not be available on your system currently. Below is a basic overview of the designer system and is far from exhaustive.
The Field Track report designer is an extremely powerful option available to Field Track and allows you to create new reports, or edit existing ones. All the reports within Field Track were designed in Field Track itself! The designer uses a combination of SQL data structures and report designs. All reports come with both, however it possible to export, or import the data structures only to start a completely clean report. In most cases it is easier to take an existing report and make your own, however to realise the abilities the report designer offers to the more advanced user are important.
Data Structures
Data structures are simply SQL strings and Field Track provides a Query Wizard to aid in creating this. The creation of SQL data structures is outside the scope of this help file.
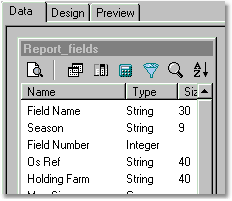
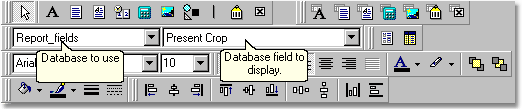
Use the "Data" tab to create/edit the data structure.
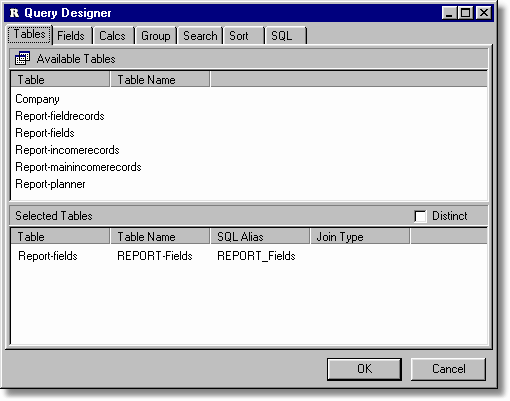
Select your tables for the data structure.
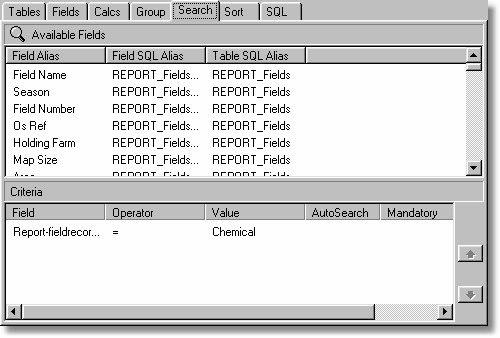
You can search for only certain records. For example all the "Chemical" reports will only present "Chemical" records to the report.
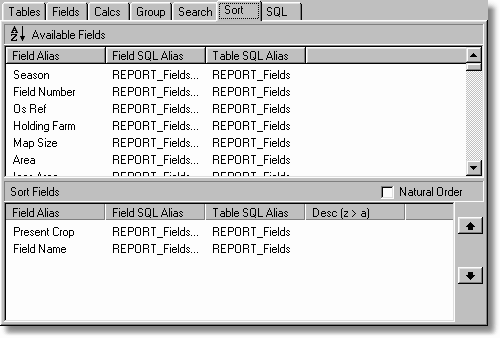
Decide the search order of the report. Your report groups rely on the data being pre-sorted, as a group heading change is what triggers your reports 'group' to change.
Report Design
Reports are easy to design once the report's Data Structure is complete.
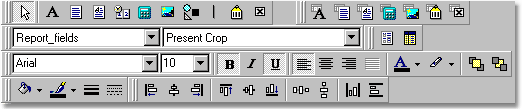
The designer provides an array of tools to create your reports:
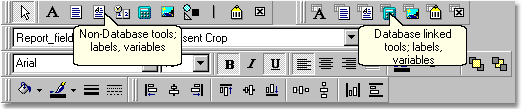
You can add labels, memos, and variables in two ways:
Non-Database
These are not related to the database, thus add a label and give it a caption relative to what it will display. Your text is what will appear in the report.
You have the option to include: Labels, memo, rich text memos, system variables, variables, pictures, shapes, lines, barcodes and checkboxes.
Database Linked
These components are the same as above but the displayed information will be taken from the database. Add a DBLabel and then tell it which database field you wish it to take it's information from.
You have the option to include: Labels, memos, rich text memos, database calculations, pictures, barcodes and checkboxes. These components take information from your database.
Component Alignment:
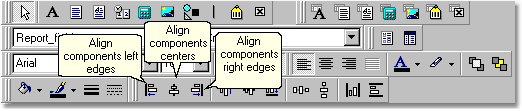
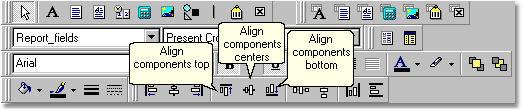
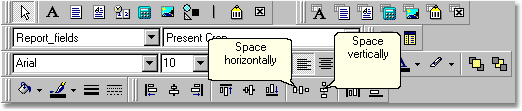
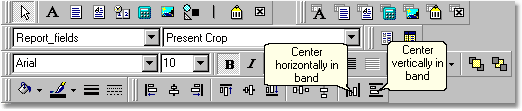
You can align your components using the align toolbar options.
Each component can also be altered for display format and calculations:
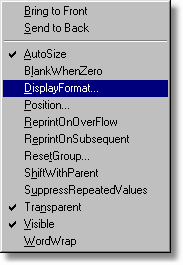
Right-click a component to alter its settings.
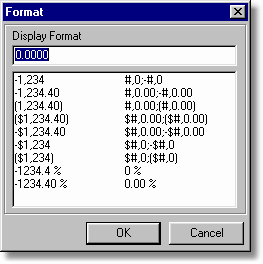
Change the information's formatting. You will be offered different format types depending on the type of component, or underlying database field structure.
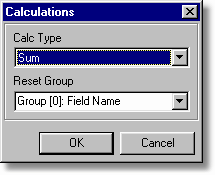
Change the type of calculation of a DBCalc field.
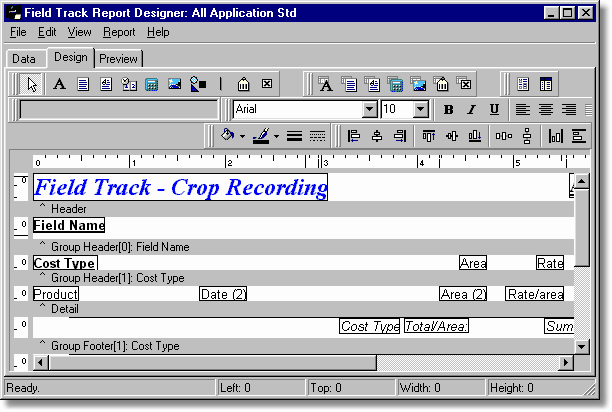
Bring it altogether to create a complete report structure.
Review the online help from within the report designer for further assistance, if available. Use the "Field Track User Club" to field your queries about how to use this powerful reporting system with your field records.