Use the horizontal 'Splitter Bar' above the application lists (assuming the application lists are at the bottom) to alter the size of the application lists. The vertical 'Splitter Bar' between the two application lists allows you to alter how much of each list you can view.
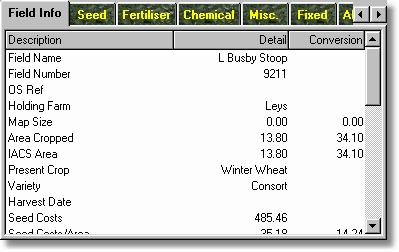
Field Info
This tab can be renamed in your configuration settings but is always the left most tab and provides a list of details about the field. The "Conversion" column uses your default area conversion 'figure' to provide an alternative area based cost analysis.
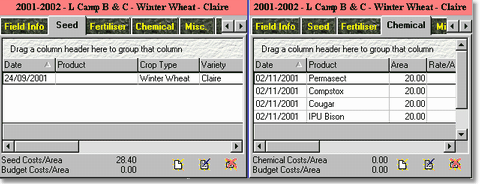
"Seed", "Fertiliser", "Chemical", "Misc.", "Fixed" and "All Applications"
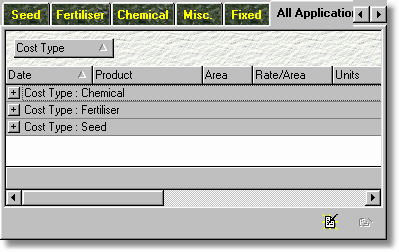
These detail the field's application costs. Lists can be customised. The "All Applications" list details all costs against a field.
"Main Income" and "Secondary/Misc Income"
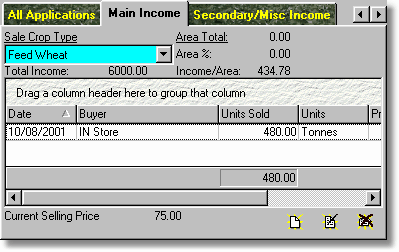
These detail the income on the field. Main Income works slightly differently than all other income records.
Graphs
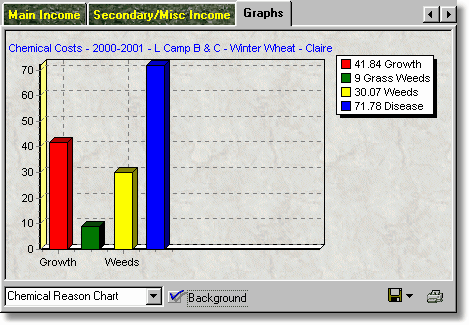
You can see useful graphs relative to the field under the "Graphs" tab. Chemical 'Product Type' and 'Reason' are very useful. Field Track will, at times, clear this graph to limit any confusion. Changing fields will clear the graph incase you mistake the graph for the wrong field. Clicking on the graph will toggle the legend display on and off. You can print your graph, as well as save it to disk, or the computer's clipboard for integration into another application. Switching the "Background" off aids in a better printout.